Table of Contents
Introduction & Disclosures
Macro Events in 1H2024
Micro Trends in 1H2024
Events and Trends in 2H2024
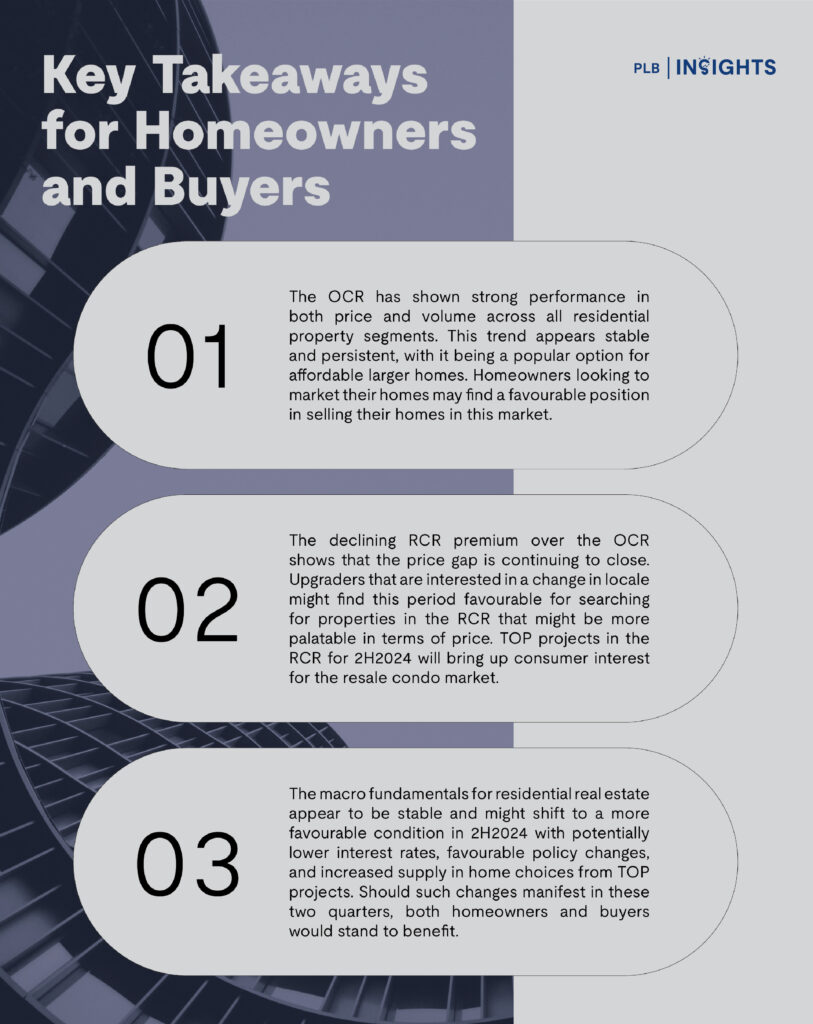
Key Takeaways for Homeowners and Buyers
Introduction & Disclosures
In this biannual report, PLB will be covering the major events and developments that impacted Singapore’s real estate market. It will be addressing the macroeconomic and policy influences on the movements in the different segments that span across Outside Central Region (OCR), Rest of Central Region (RCR), and Core Central Region (CCR) regions across Singapore in the Condominium (Condo), HDB, and Landed market segments. This report will cover the residential property market exclusively.
Our approach to analysing real estate price and volume movements will vary from previous quarterly reports. The main source of data on micro trends are provided by RealInsight. We supplement this with macroeconomic data from the US Fed, NUS Real Estate, and other government agencies. The analysis will be guided by how macroeconomic events shape micro trends in Singapore’s real estate market, with a focus on how future macroeconomic events will impact the movements in price and volume for various market segments in the second half of 2024.
Readers may refer to the executive summary above or the key takeaways at the end of the report for the main points. The sections on the macro and micro events and trends will cover in more detail the rationale and direction of price and volume movements across different segments of the real estate market. Whilst these trends cover the primary direction of the market movement, do note that there may be particular real estate projects that defy market trends due to special characteristics or extenuating circumstances. This biannual report will not cover such exceptions.
Most of the data used in the report will be on a monthly basis. Do note that when the volume of transactions are low, the monthly variation in prices may be inflated depending on the specific properties being transacted on the market. This effect will be more pronounced in Condominium and Landed segments in particular. Prices denominated in per square foot (PSF) basis and quantum basis are averages taken for transactions in the same month of the same category. The data is taken at the time of writing on 29 July 2024. We make no warranties on the accuracy of the data provided by third parties.
Please consult a professional real estate agent for advice prior to making an informed decision on your property transaction. You may contact us here if you have any questions regarding how developments covered by this report may affect your property decision.
For more information and valuable takeaways on Singapore’s real estate market, check out our editorial webpage.
Macro Events in 1H2024
The macroeconomic data and events that we will be covering in this biannual report are US Federal Funds Effective Rate that affect interest rates governing property loans, Singapore’s consumer sentiment for the property market, policy shifts and government land sales (GLS) in the first half of 2024.
US Federal Funds Effective Rate is an important indicator of where interest rates for home loans are likely to head towards in the future. Interest rates for home loans guide buyer sentiment as it affects their cost of borrowing and monthly mortgage payments significantly. Higher interest rates can slow down property markets by restricting buyers’ choices based on the higher monthly mortgage payments, effectively reducing the affordability of certain properties.
As shown in Figure 1 below, in a previous monetary tightening cycle of similar magnitude prior to the 2008 Global Financial Crisis, the Fed Funds Rate peaked for approximately a year around 5.25% from July 2006 to July 2007. Presently, the Fed Funds Rate peaked at 5.33% from August 2023 and would soon match the duration of the 2006-2007 monetary tightening cycle.
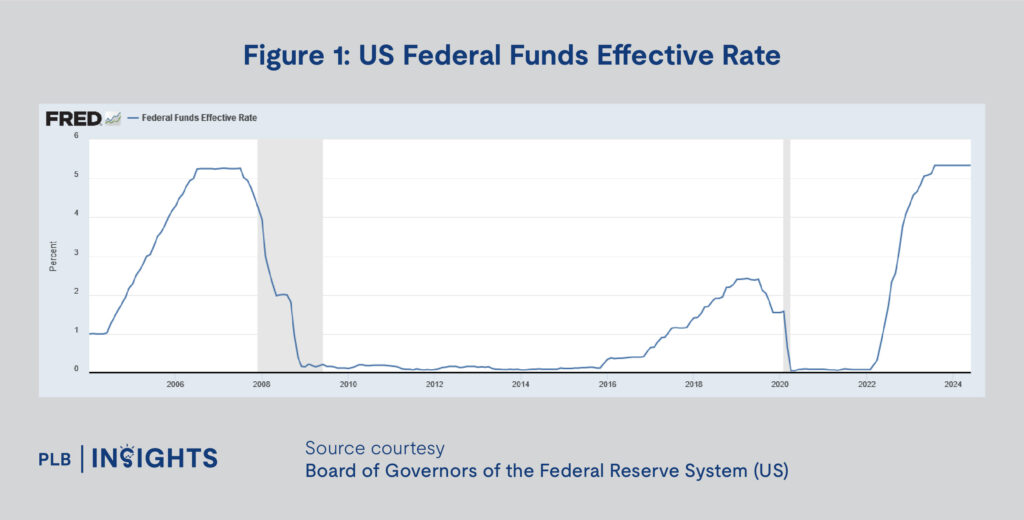
In the first half of 2024, heightened interest rates may have dampened buyer confidence in higher quantum properties. However, the markets may have also adjusted to the high interest rates given that it peaked in the second half of 2023. There may only have been a mild effect on the residential property market.
There is evidence to believe that the market has already adjusted to the high interest rates and is already looking forward towards potential future interest rate cuts. The NUS Real Estate Sentiment Index shows that ever since the interest rate peaked in 2H2023, real estate sentiment has been improving quarter on quarter.
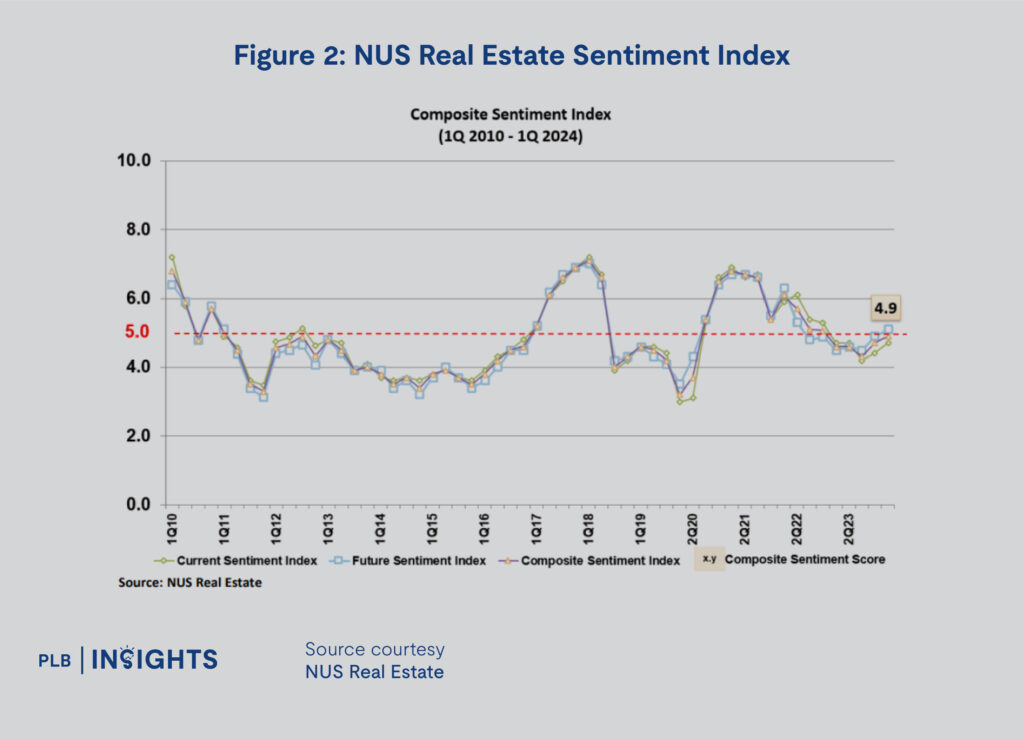
While the latest 2023Q2 data is not yet released as at the time of writing, the data from Figure 2 shows that real estate sentiment is presently neutral but is on a good upward trend. The forward looking nature of sentiment indices may point to brighter times ahead for Singapore’s real estate market. However, sentiment itself might not translate to movements in property prices as transactions are typically slower for the property market and consumers in Singapore’s market have a stronger holding power.
Note that while property sentiment has fallen from the middle of 2021 to 2023, likely influenced by the steep interest rate hikes from the US Fed, residential property prices in Singapore have not fallen at all. Instead, sentiment might be more reflective of how the volume of transactions might change in the future.
Next, the first half of 2024 saw the introduction of new property tax changes and ABSD remissions announced by the government in the Budget 2024. In summary, the property tax changes involved increasing the annual value of property in the tax brackets, essentially favouring existing homeowners and reducing the amount of property tax most homeowners would have to pay.
The ABSD remissions announced in Budget 2024 apply to singles over the age of 55, basically addressing property down-sizing for older Singaporeans. This eases the timeline of moving to a property of a lower value. For instance, the ABSD payable for buying a lower valued property as a second property will be in remission if the buyer over the age of 55 sells the first property of higher value within 6 months of the new purchase.
These policies target specific needs of the population. The new property tax changes adjust the tax payable on property inflation to ease the tax outflows for residents in middle-class properties. The ABSD remissions eases the process for property downsizing for singles above the age of 55. While it may not be significant enough of a change to move the property markets, it nonetheless signals the sensitivity of government action to the voices and needs of the public. We may expect policy action when valid concerns are raised by the public.
Recent GLS such as the ones in April and July have drawn attention to the decline in developer interest in the sites sold by the government. The number of bidders and placed bids have both decreased. In April, Zion Road and Springleaf sites drew bids that were below expectations. This was interpreted as cautious sentiment from developers due to the markers of slower demand in the first half of 2024. While the Zion Road site subsequently received higher bids in July 2024, cautious developer sentiment was still echoed in the bids for GLS sites in Canberra and De Souza Avenue.
The cooled down GLS market may signal more than just cautious developers. This might not translate to lower real estate prices in the future but might signal a potential disinflation of new launch property prices in the coming years. With developers closely watching how the current market is absorbing new condo launches and upcoming TOP resale transactions, we might see the GLS market shift as a response in the second half of 2024.
Overall, the macroeconomic data and events indicate that the real estate market in Singapore may have normalised and is now positioned to be cautiously optimistic and awaiting a bullish catalyst to push residential property volume, and potentially prices further up.
Micro Trends in 1H2024
In this section, we will analyse the price and volume trends in the Condo, HDB, and Landed property segment by region. We broadly abstract price and volume movements from January to June and discuss the implications of micro trends across the different market segments and regions.
Condominium Sub-Segments
Resale Condo OCR prices and volume appear to be steadily increasing at a modest rate. From Figure 3, we note 635 transactions in January and 663 transactions in July, volume increased by 4.4%. The overall volume for 1H2024 for resale OCR also appears to be slightly higher than 2H2023.
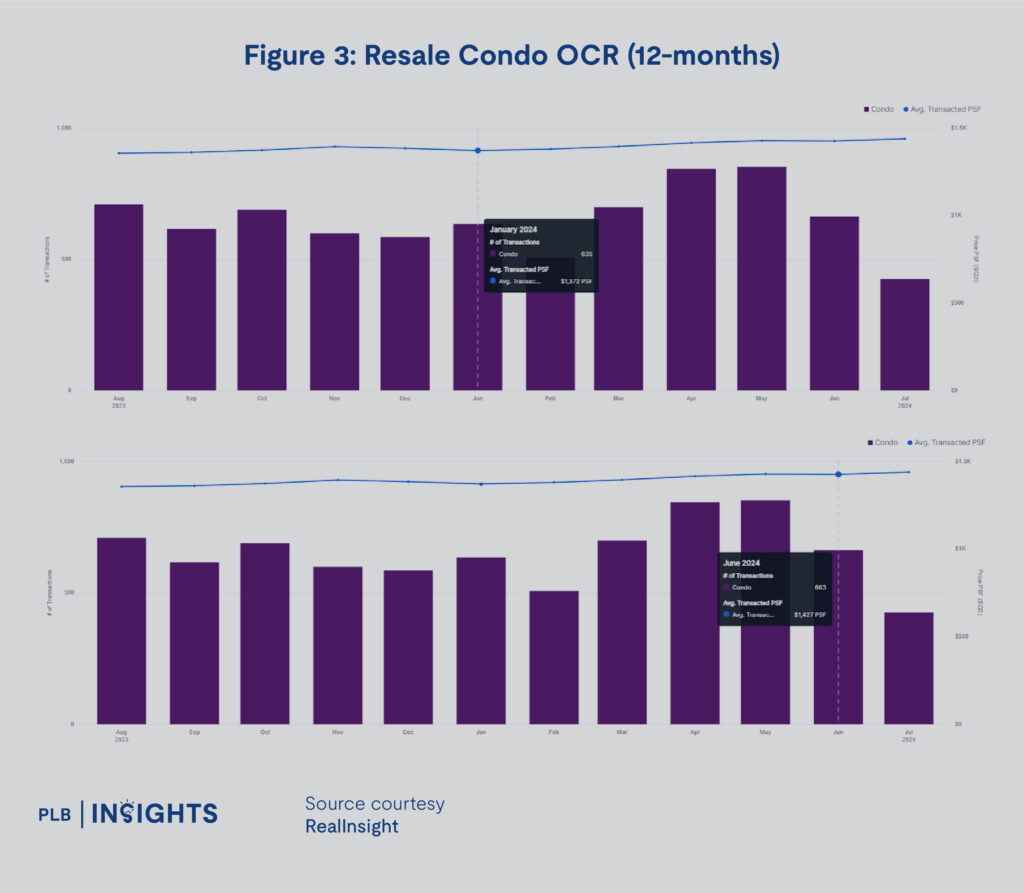
The price of resale condos in the OCR has also increased by approximately 4.0% in 1H2024, from $1,372 PSF to $1,427 PSF. The price and volume trends in this sub-segment appear to be relatively stable and are unlikely to change despite some fluctuations in volume. We expect resale condos in the OCR to continue seeking gains in 2H2024.
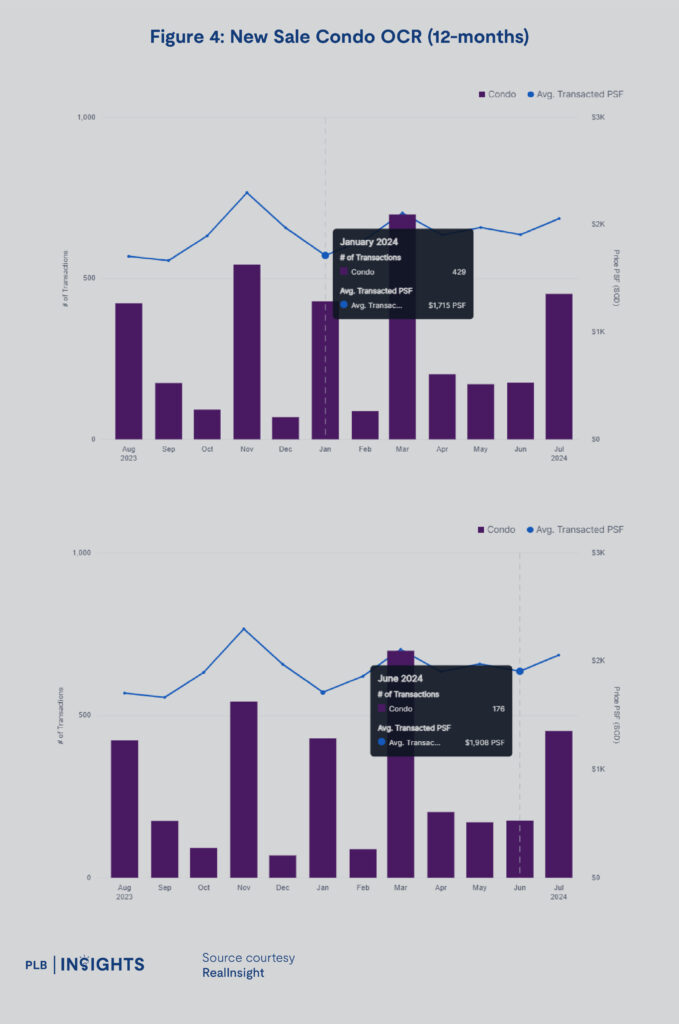
Next we turn our attention to the New Sale condo performance in the OCR. Figure 4 below shows that transactions fluctuate as expected from the new launch market. What is of note is the relative increase in new launch condo prices in the OCR from $1,715 PSF in January to $1,908 PSF in June, marking a 11.2% increase.
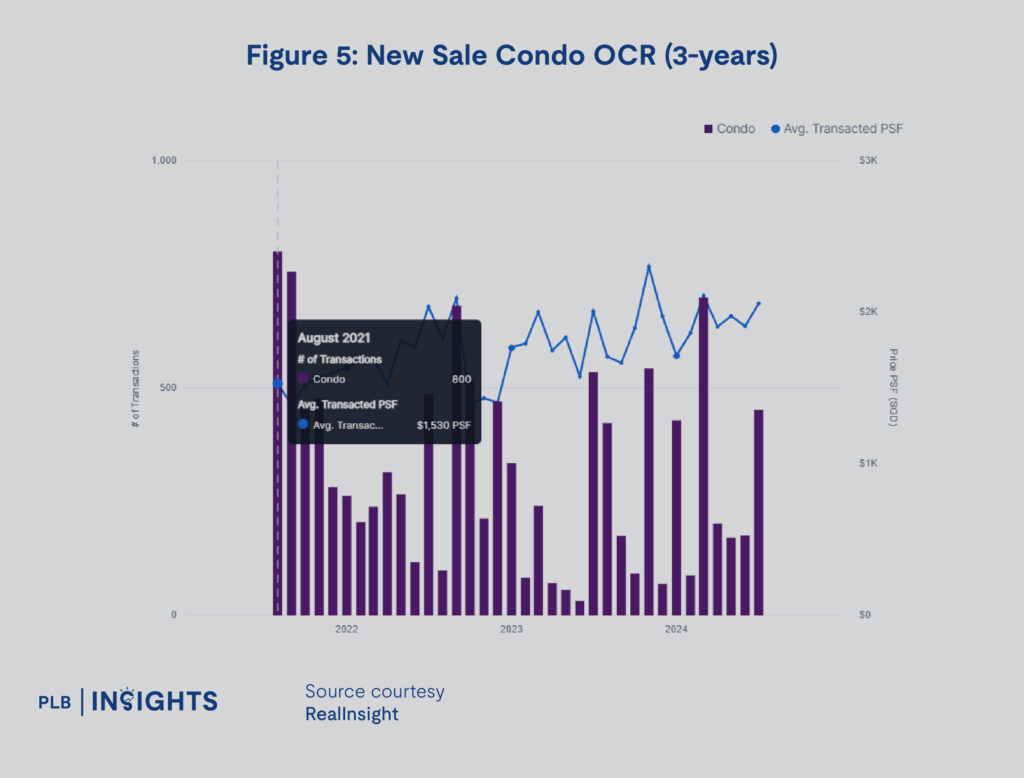
It is a known fact that the present real estate market sees new launches push up prices due to cost-push inflation over the past year of launches. Rising costs push developers to price new launches more aggressively. However, Figure 5 below shows that there is a high volume of new launches from August 2021 to November 2021 that are approaching their TOP in 2H2024 and this might put resale OCR condos in a more competitive position against new launches in 2H2024 due to the pricing disparity.
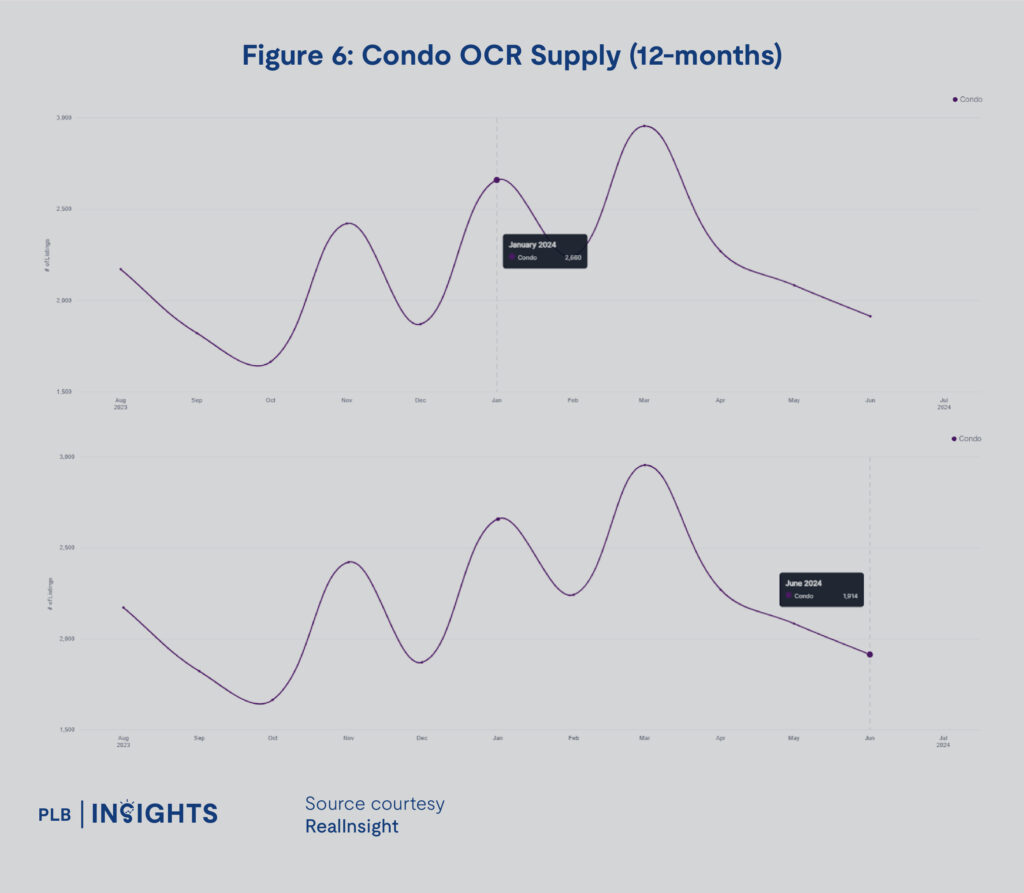
From Figure 6, 1H2024 saw a decrease of 28.1% in the supply of OCR condos from 2,660 in January to 1,914 in June. This signals a strong absorption from the market and potentially higher prices due to declining supply. However, if resale OCR condo homeowners from 2H2021 purchases decide to offload their properties upon TOP, we may see an increase in the supply of OCR condos to meet the demand of the market.
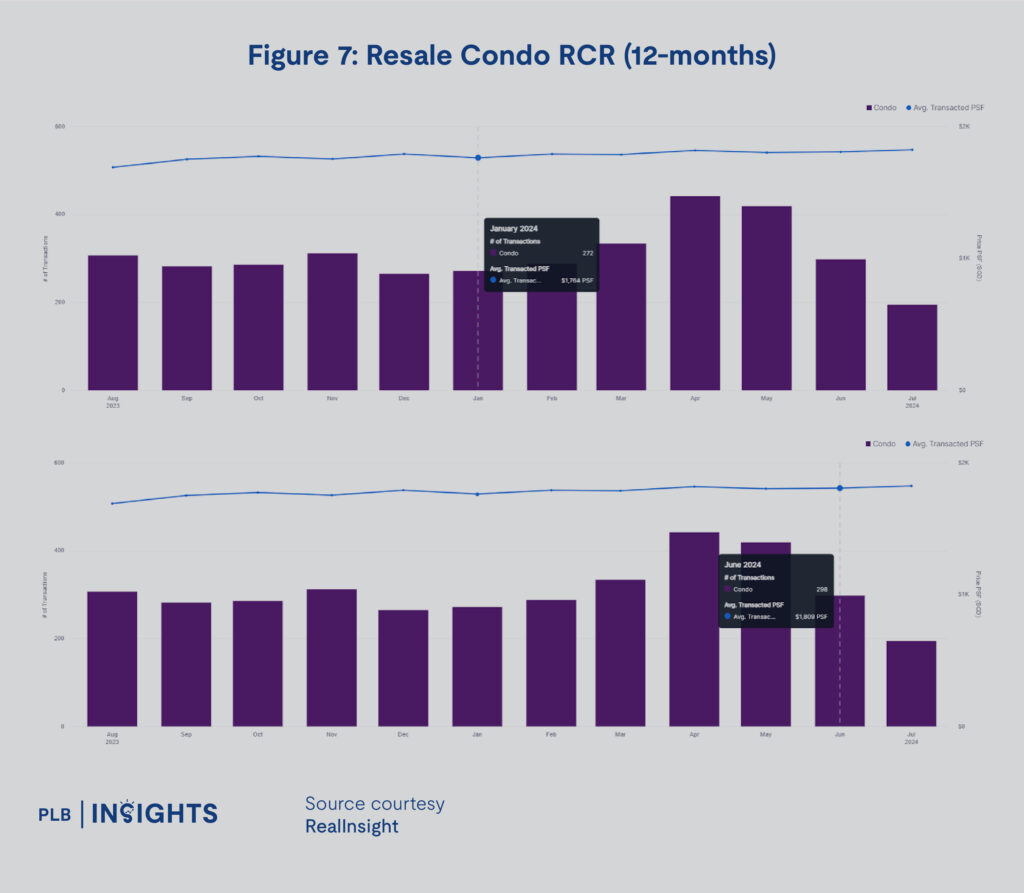
Next we move on to the RCR Condo segment. Similar to the OCR Resale Condo sub-segment, the RCR Resale Condo sub-segment sees stable increase in both price and volume in Figure 7. The number of transactions increased from 272 in January to 298 in June, marking a 9.5% increase. The prices have also increased from $1,764 PSF in January to $1,809 PSF in June, a 2.5% increase.
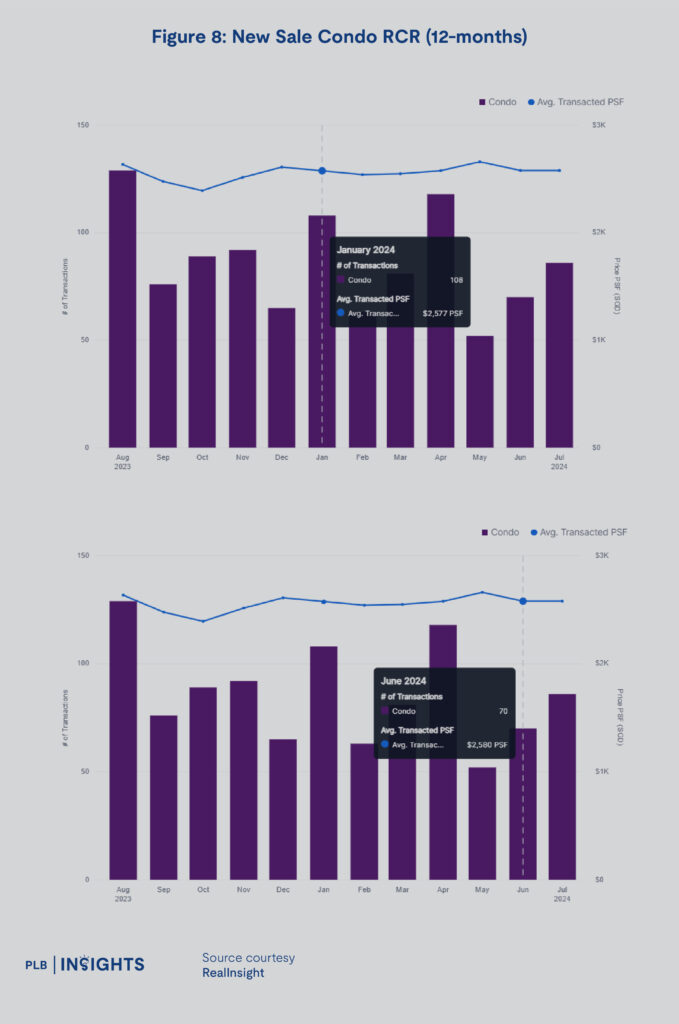
Compared to the New Sale Condos in the OCR, the RCR sees a more stable price and volume trend in Figure 8. This may be due to the spaced out timings of various launches over the past year. While there are some price and volume fluctuations throughout the past year, trends remain surprisingly neutral in this sub-segment, signalling potential saturation and relatively higher competition in the new launch market for RCR.
We further examine the previous condo launches 3 years ago in Figure 9 and notice a similar trend with OCR condos in the RCR. A high volume of RCR condos in 2H2024 and 1H2025 will bump up attention towards the resale market as buyers in the future may have more attractive choices that meet their personal needs in the RCR.
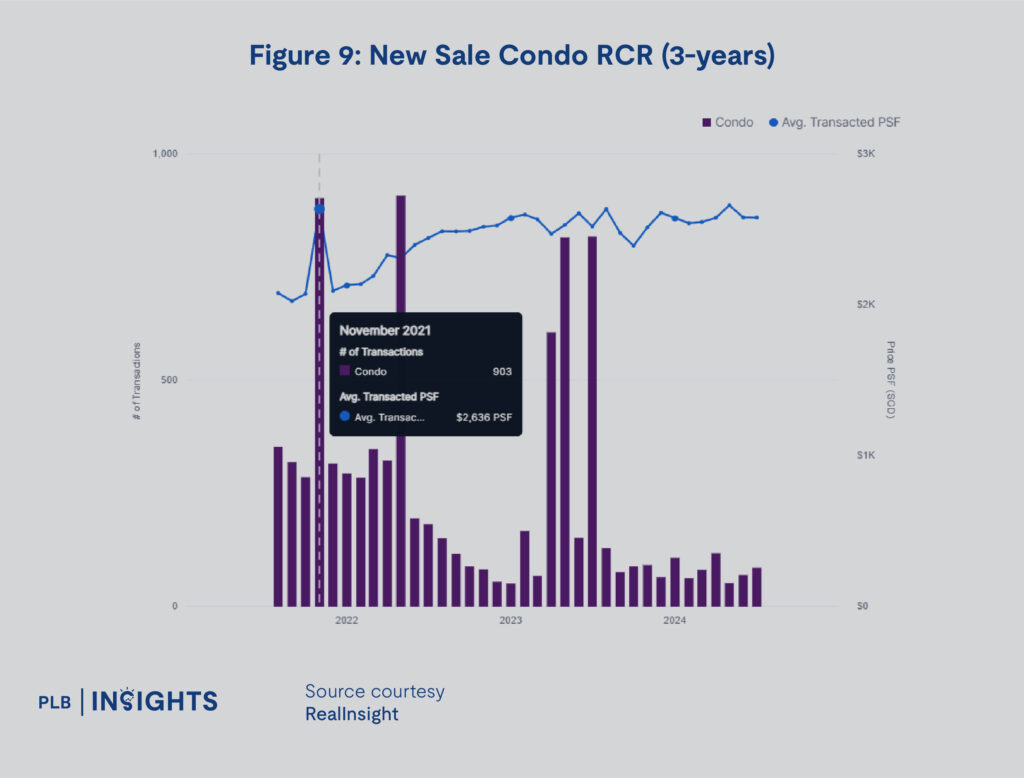
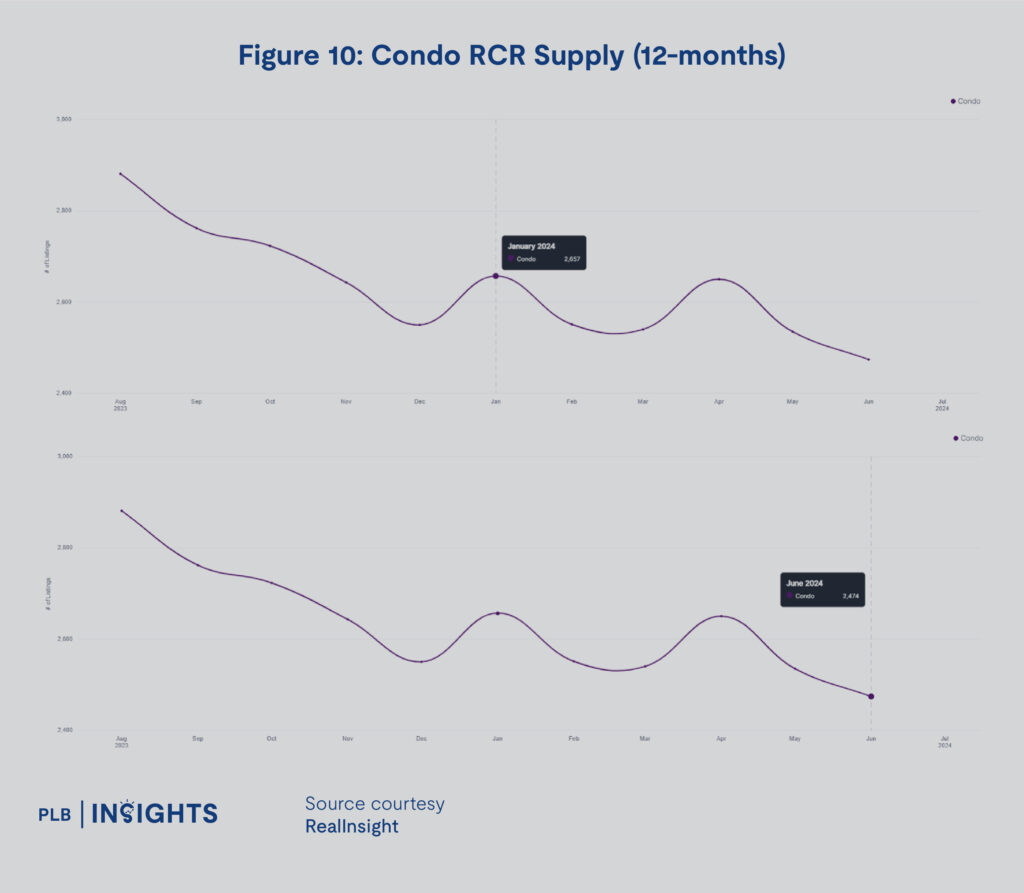
The condo market sees better absorption of supply in the RCR. From Figure 10, we see a stronger trend of decline in the supply of RCR units from 2,657 in January to 2,474 in June, marking a decrease of 6.9%. While this is a lower percentage number compared to the OCR market, the trend of decline appears to be more persistent. The surge of TOP RCR units over the next year may alleviate this downward trend.
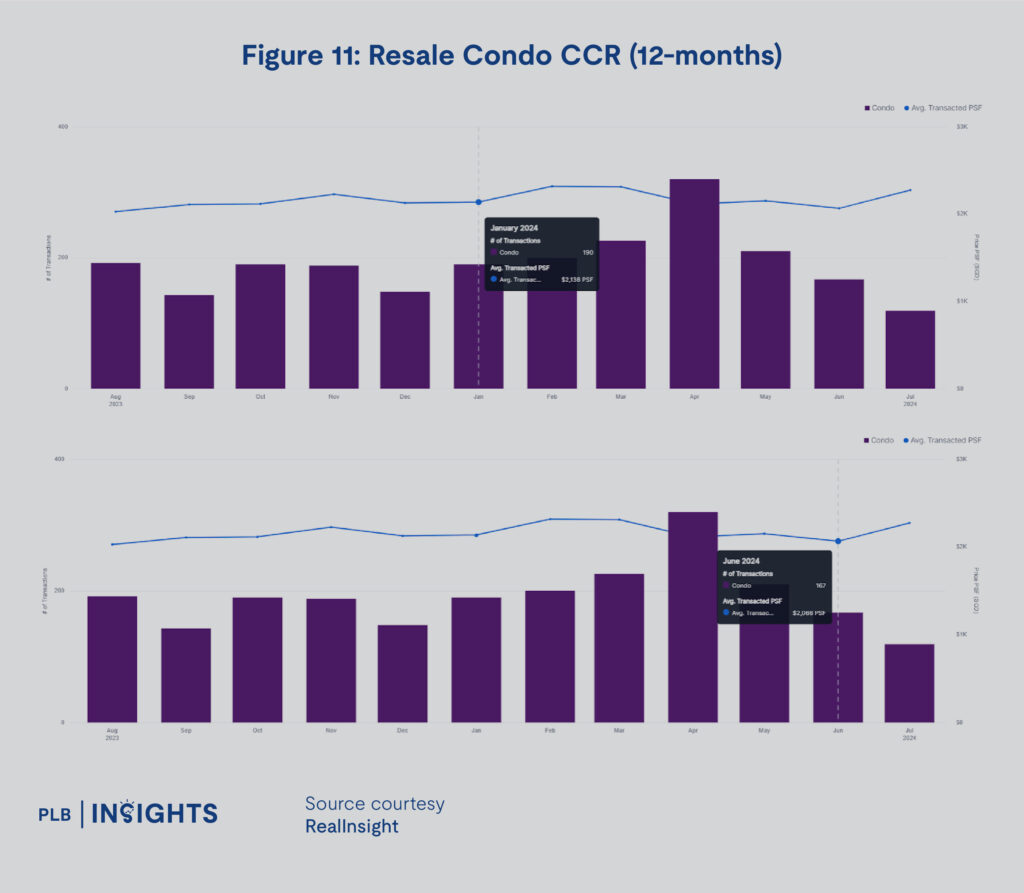
Finally, we move onto the CCR Condo segment. Resale CCR Condos appear to have a slight decline in price from $2,138 PSF in January to $2,066 PSF in June, a decline of 3.4%. This, however, may be led by differences in projects transacted between months due to the variance in prices across CCR projects. The volume of transactions show no abnormal movement, April and May appear to be strong volume months for the condo market in general.
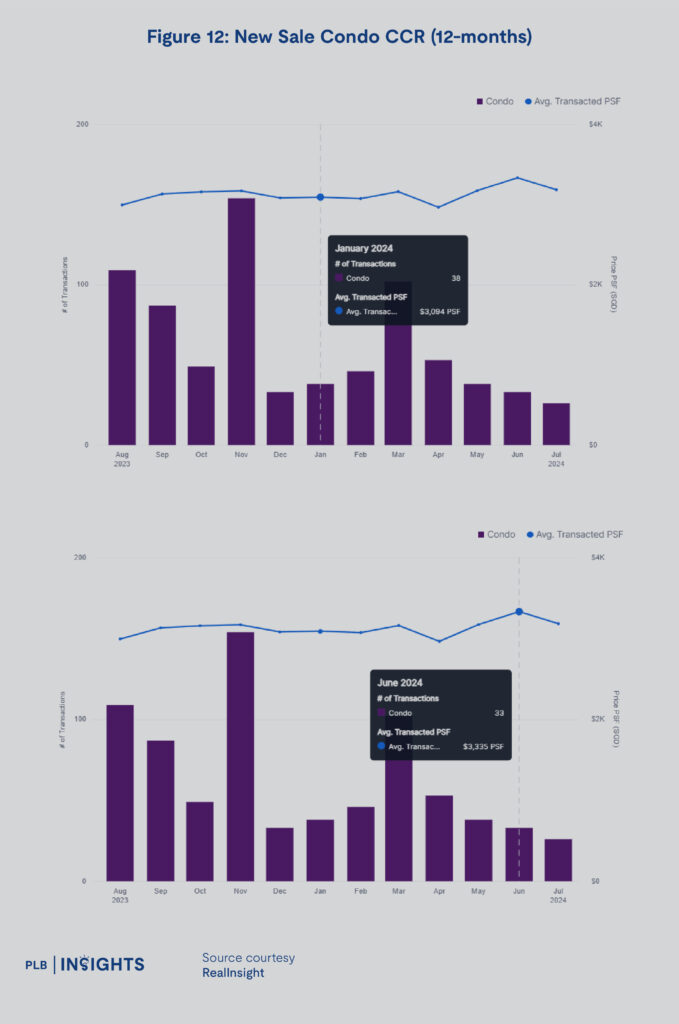
While resale CCR condos experienced a mild decline in price, we see an increase in price for new sale CCR condos. Figure 12 below shows an increase in price from $3,094 PSF in January to $3,335 PSF in June, marking an increase of 7.7%. Volumes were stable barring a peak of almost 100 in March.
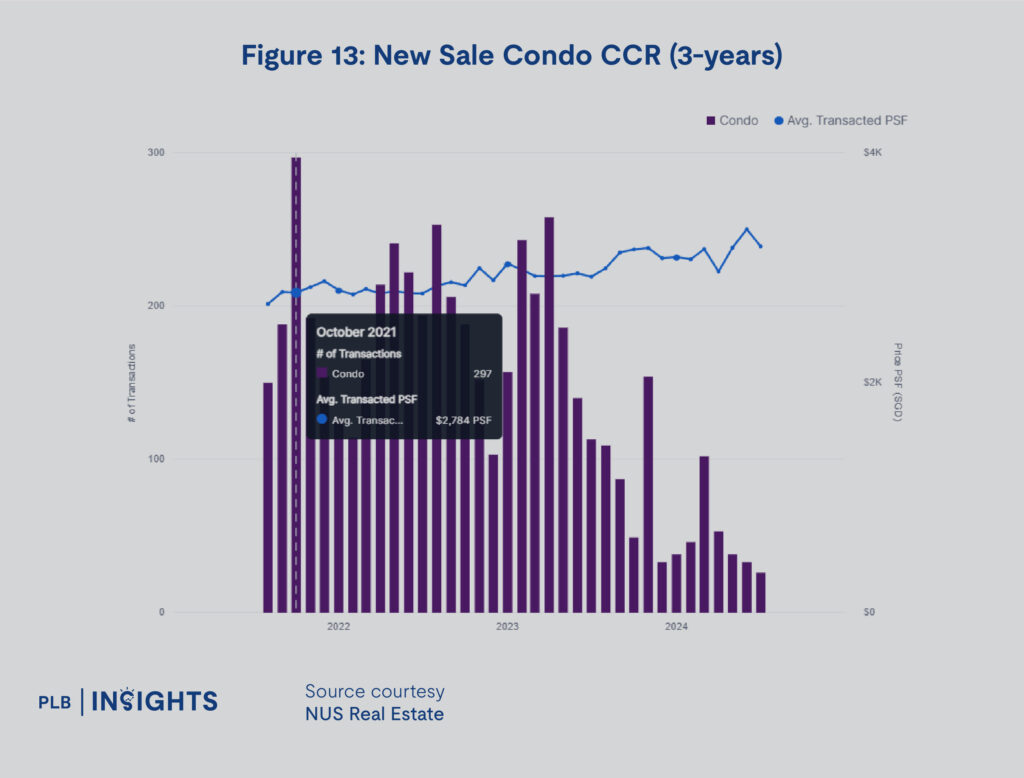
Similar to other condo sub-segments, the number of CCR condos that have launched 3 years ago vastly outnumber the ones in 1H2024, as shown in Figure 13. This signals that across OCR, RCR, and CCR, the resale market may be seeing more volume and buyer attention in 2H2024.
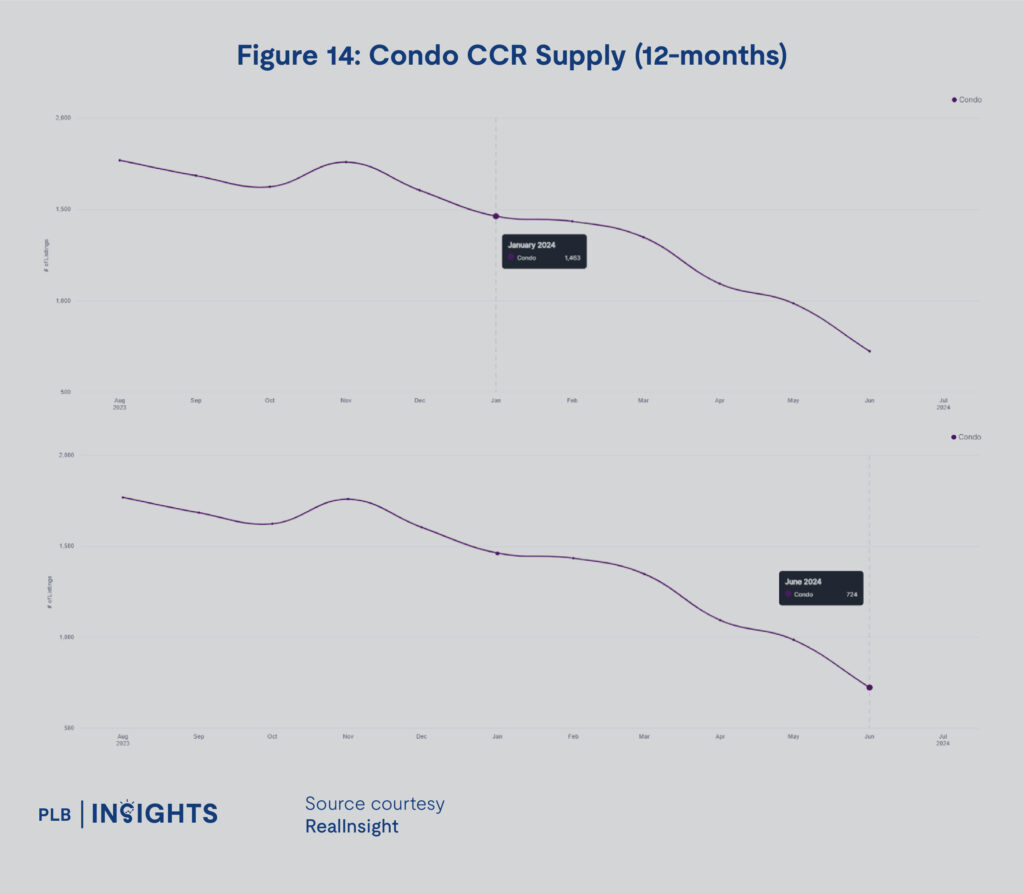
From Figure 14, the supply of CCR condos are also seen to be on the decline. Supply fell from 1,463 units in January to 724 units in June. This is the sharpest decline across all condo segments, coming in at 50.6% decrease in supply. The TOP units in the CCR may see this trend reverse in 2H2024 and beyond.
Resale HDB Sub-Segments
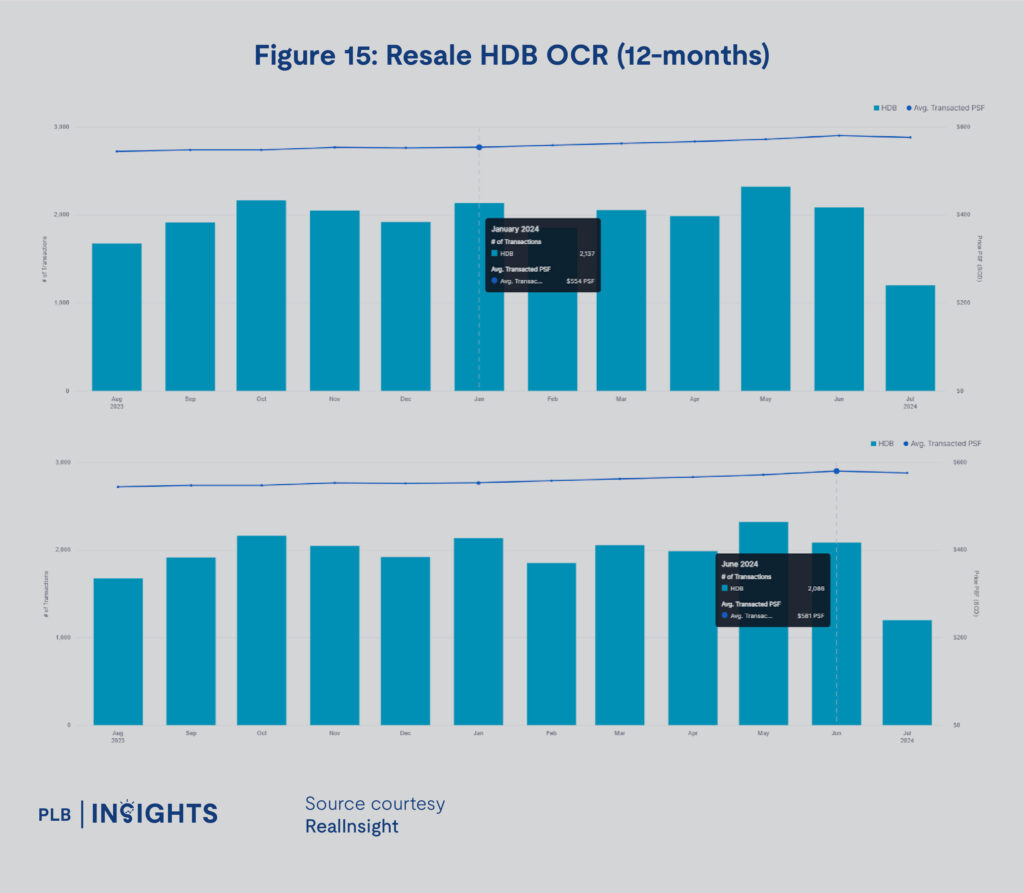
From Figure 15, the OCR HDB sub-segment saw a slight increase in price from $554 PSF in January to $581 PSF in June, marking a 4.8% increase. The trend in price and volume look relatively stable in Figure 15 and would seem to persist in 2H2024, with potentially higher prices. While there are some fluctuations in volume, there is no abnormal volume over the past year.
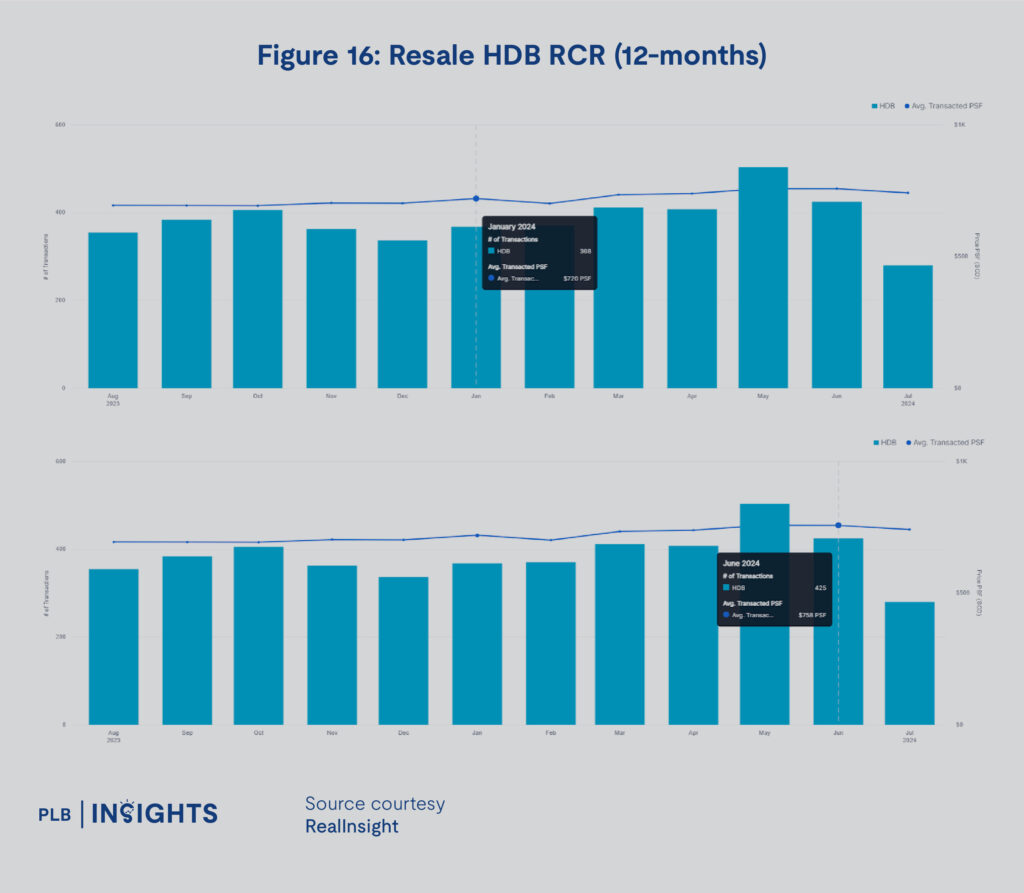
From Figure 16, the RCR HDB sub-segment shows a mild increase in prices from $720 PSF in January to $758 PSF in June, marking a 5.2% increase. Volume in the RCR HDB sub-segment seems to have increased in 1H2024. January saw 368 transactions while June had 425 transactions, an increase of 15.4%.
From Figure 17, the CCR HDB sub-segment is a very small but unique niche, with most projects having low remaining lease. Nonetheless, Figure 17 shows that both price and volume have increased. Prices increased from $712 PSF in January to $739 PSF in June, a 3.7% increase. Volume increased from 25 in January to 37 in June, a 48% increase. However, these shifts may vary significantly based on the projects being transacted.
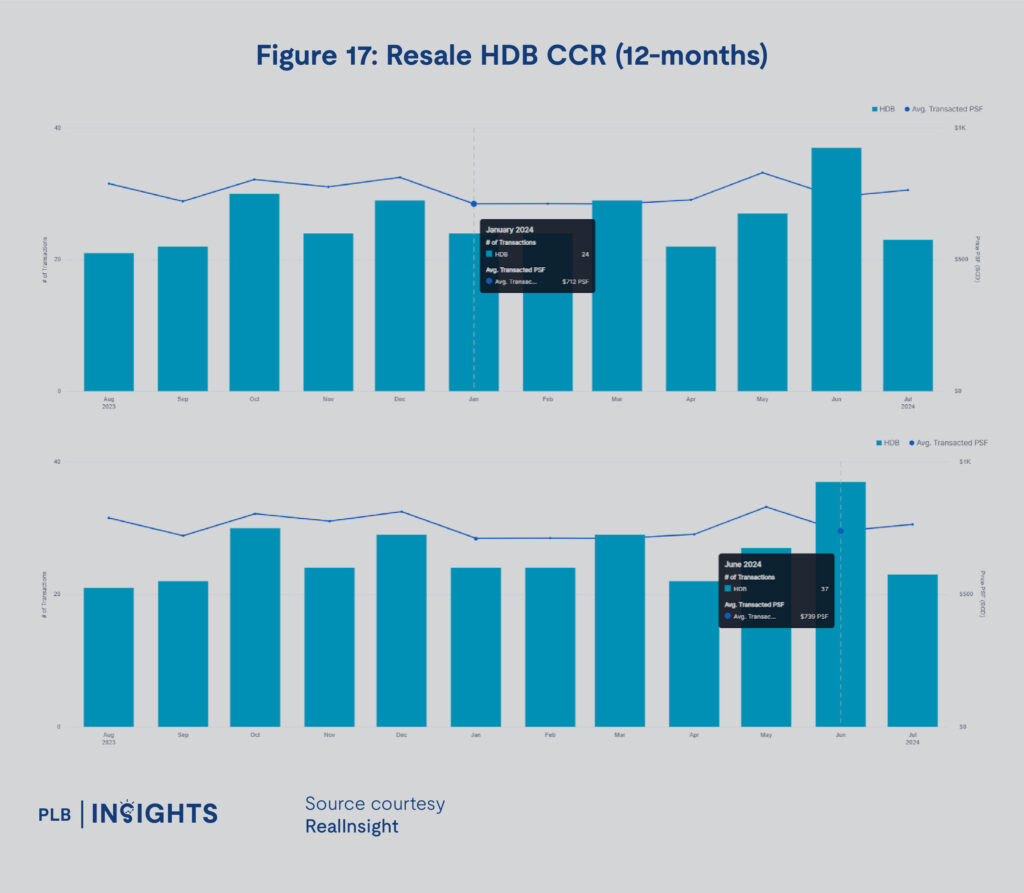
Overall, the HDB sub-segments seem to be steadily increasing in price, with stable volume. As more resale Condos enter the market, the middle-priced strata of Jumbo and large HDB flats may find more competition with smaller sized resale condos as possible alternatives for homebuyers in 2H2024.
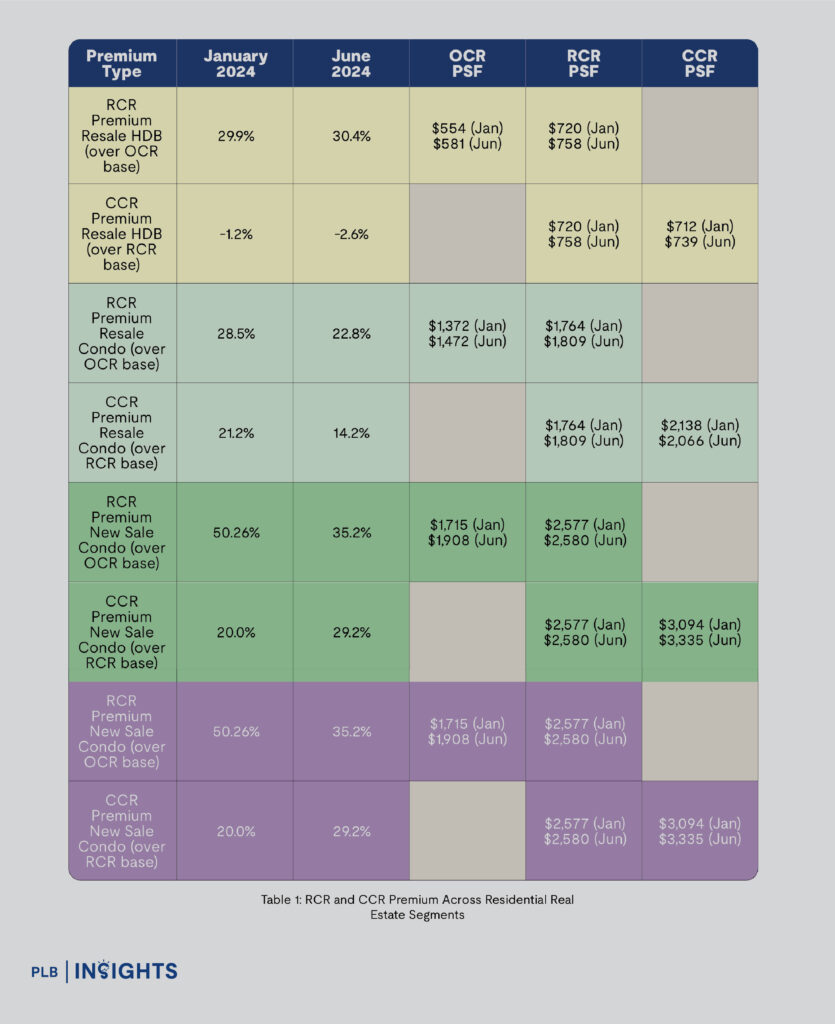
The RCR commands a 30.4% premium over the OCR for the resale HDB segment. This is compared to a 26.7% RCR premium for the Condo segment when comparing between the two regions. With June prices indicating a higher premium for the HDB RCR sub-segments, the market may be indicating more buyer interest in the resale HDB sub-segment as opposed to resale condos.
However, new sale condos have an even higher RCR premium over the OCR, sitting at 35.2%. This even higher premium seems to indicate that the demand for new homes in this region is still going strong.
Landed Sub-Segments
In the Landed sub-segments, we will examine the prices of OCR, RCR, and CCR Landed property all sales at the PSF and quantum level. This analysis will be conducted at an abstracted level and will not differentiate between the various types of landed properties in the same region. It is instead a between-region comparison to show how prices have changed across time for the OCR, RCR, and CCR.
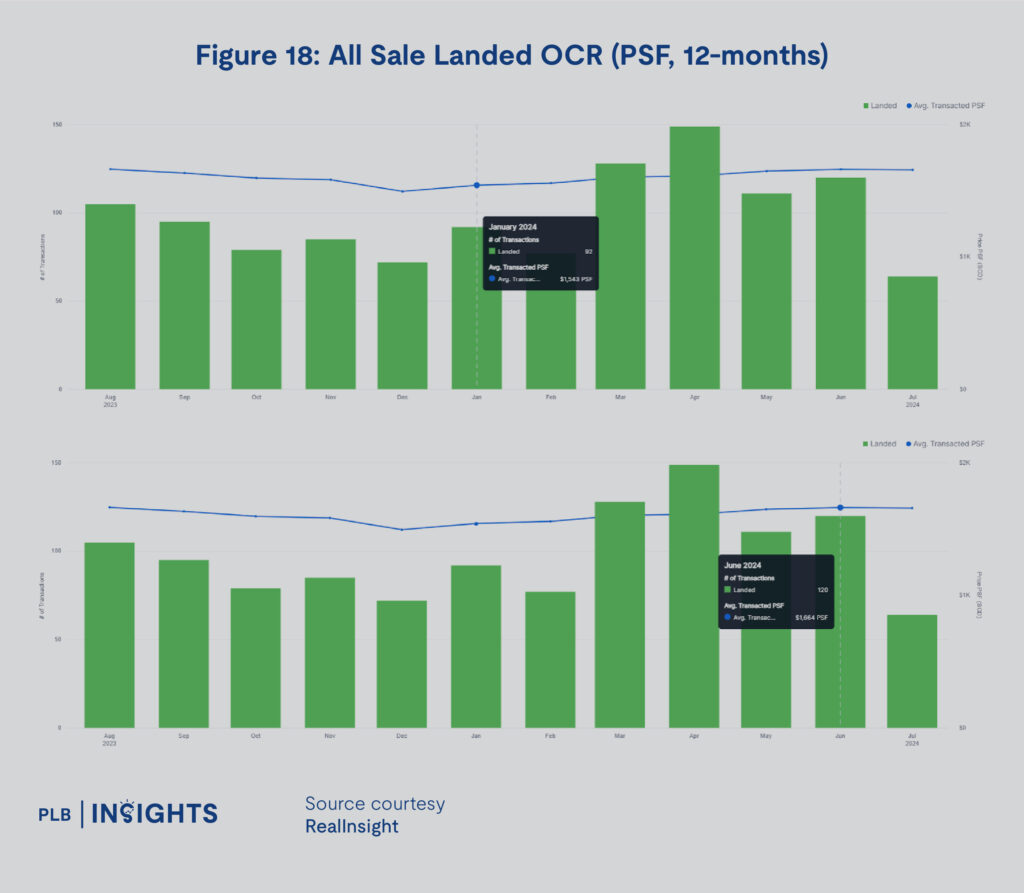
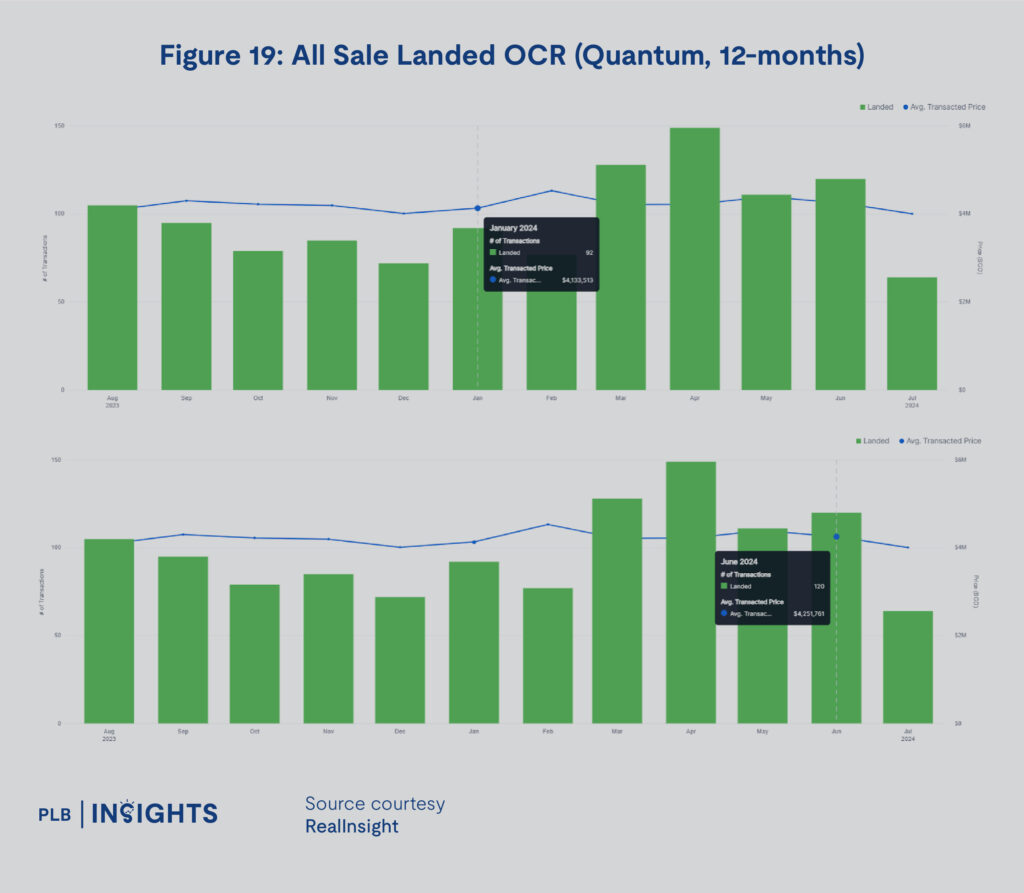
From Figure 18 above, we can see that 1H2024 saw greater volume of transactions in the OCR as well as a steady increase in price. The number of transactions rose from 92 in January to 120 in June, showing a rough 30.4% increase in transaction volume. Prices increased from $1,547 PSF in January to $1,664 PSF in June, showing a 7.8% increase in prices. From Figure 19 below, we see that the average quantum increased from $4,133,513 in January to $4,251,761 in June, showing a 2.8% increase in average quantum per transaction.
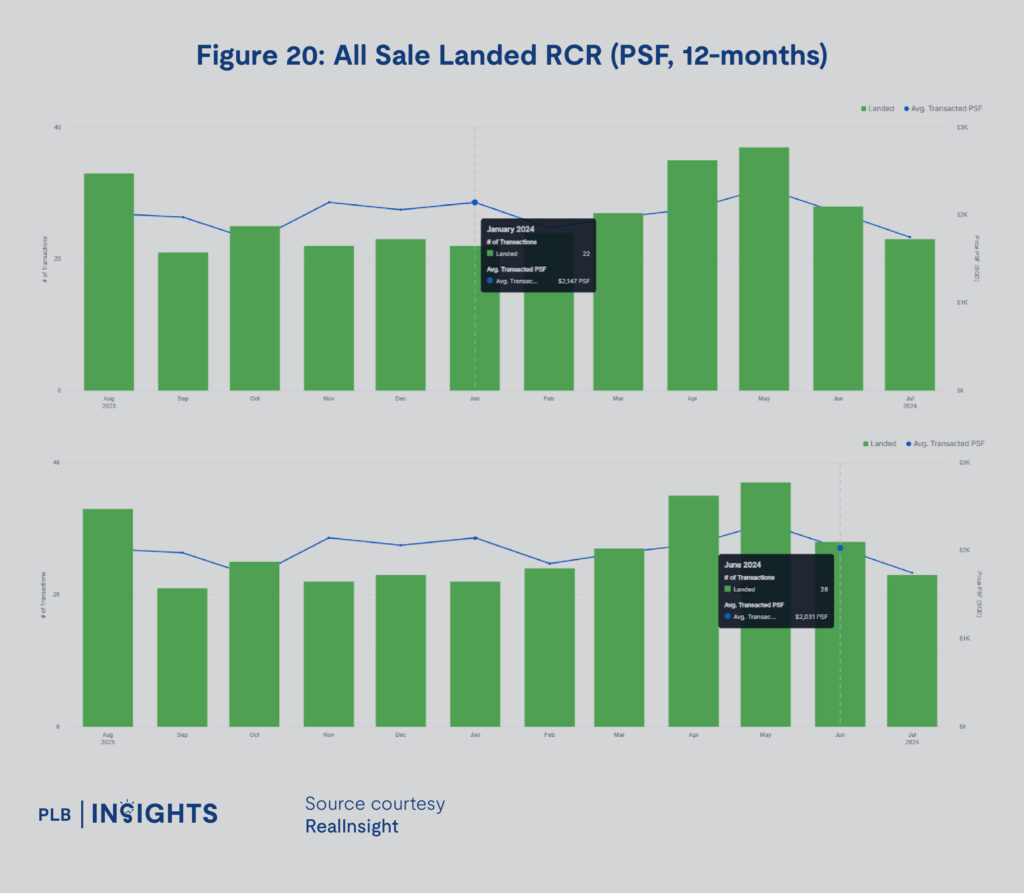
From Figure 20 below, the RCR saw greater price fluctuation for Landed properties but volume in 1H2024 appears to have improved from 2H2023. Prices moved from $2,147 PSF in January to $2,031 PSF in June, showing a decline of 5.4%. The number of transactions increased from 22 in January to 28 in June, showing an increase of 27.2% in volume. As prices fluctuate more in the RCR, the price drop in 1H2024 for RCR landed properties may not be as informative as it seems. The drop in price may be contributed by a lack of new landed properties sold or transactions in landed properties in more affordable enclaves.
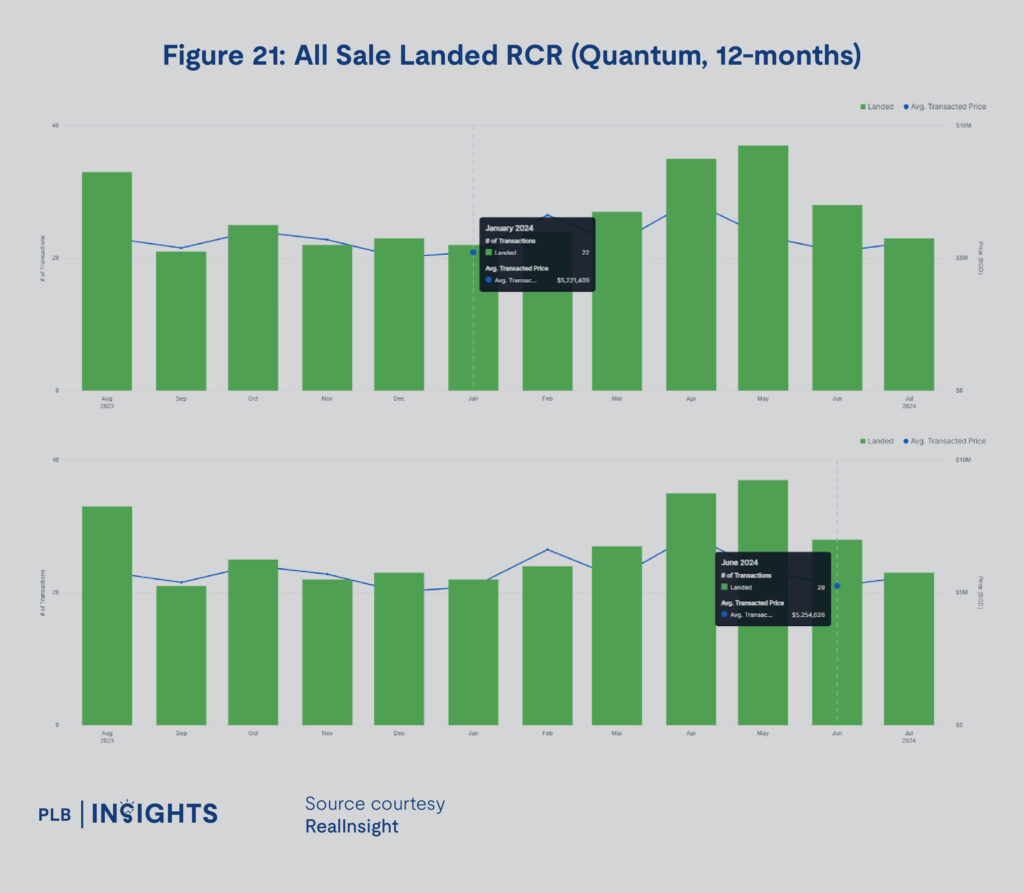
Figure 21 below shows the changes in the average quantum for transactions in the RCR over the past 12 months. The average price of a landed property in the RCR still increased from $5,221,409 to $5,254,626 despite the drop in PSF prices. This might be due to larger landed properties being sold in this region, potentially indicating a preference for larger landed homes over smaller properties.
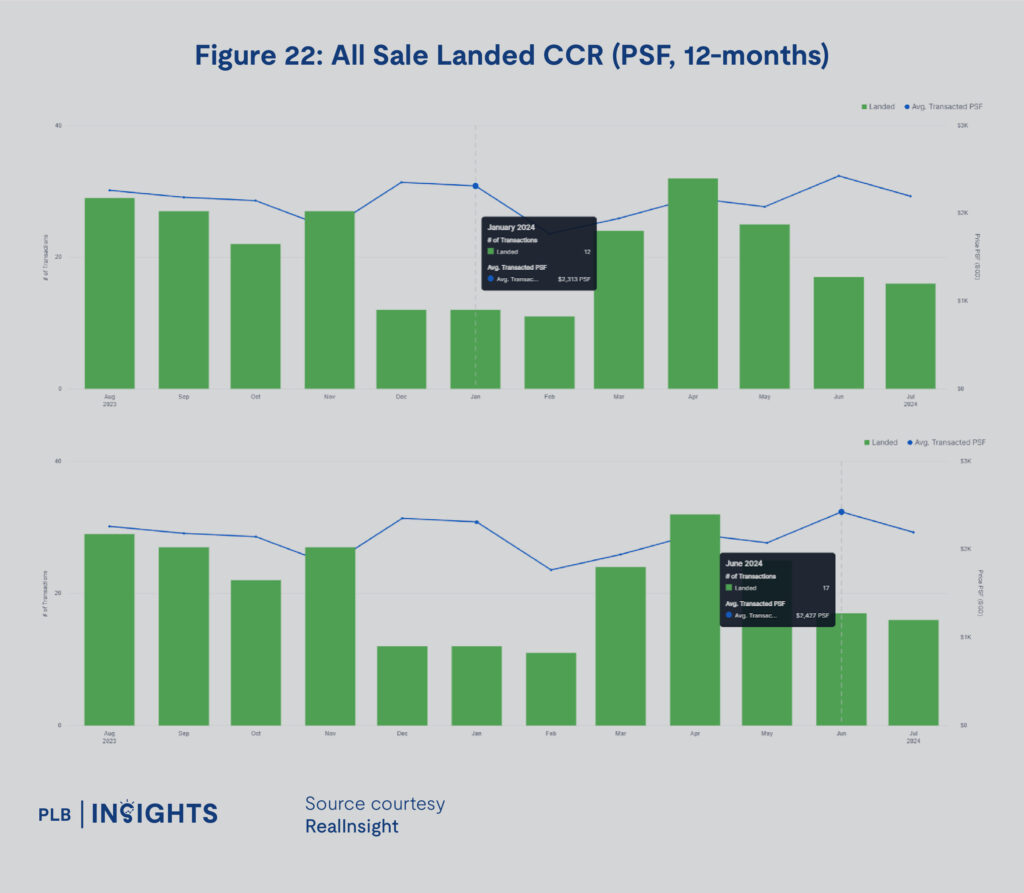
The CCR sub-segment for Landed properties see greater fluctuations in both price and volume, which is expected of lower volume niches. From Figure 22, we can see that the number of transactions increased from 12 in January to 17 in June, an increase of 41.6%. Price increased from $2,313 PSF in January to $2,427 PSF in June, an increase of 4.9%.
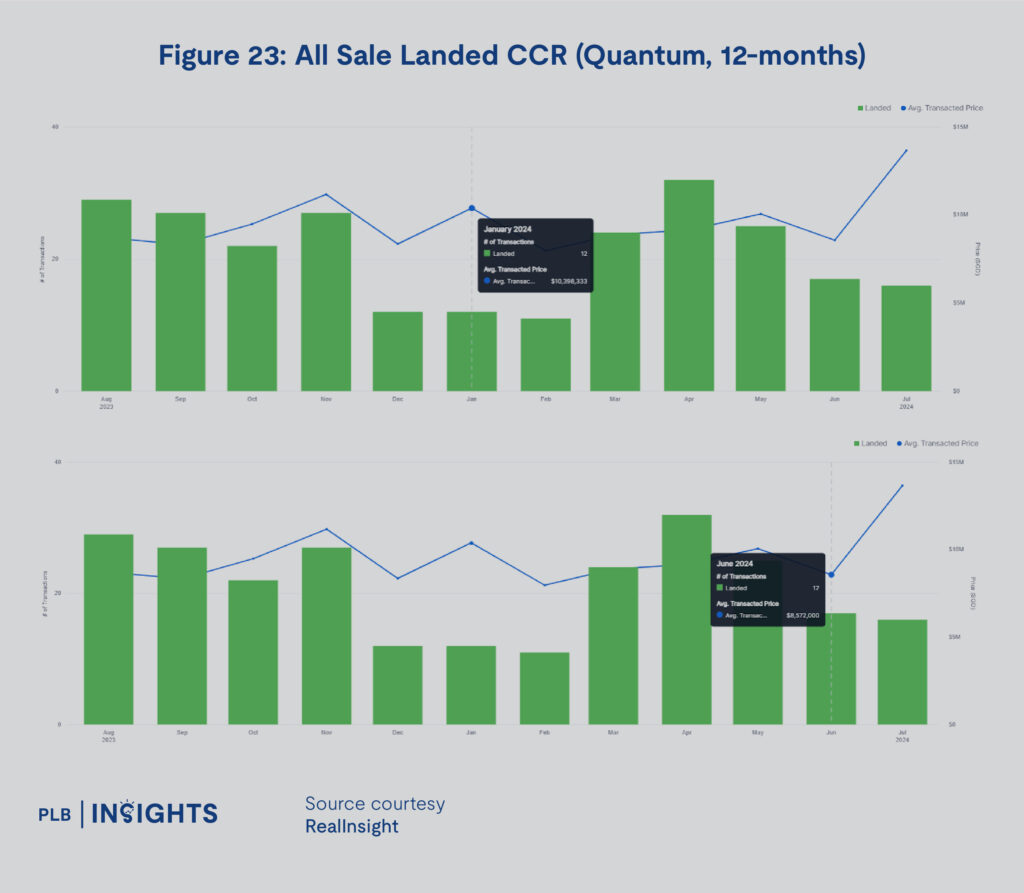
Figure 23 also indicates that the average quantum of transactions in the CCR fell from $10,398,333 in January to $8,572,000 in June. This is probably due to the low number of transactions making the average quantum more sensitive to Good Class Bungalow transactions in the market. The increase in PSF from January to June also corroborates with this view as lower quantum properties tend to have a higher PSF.
The Landed segment in 1H2024 seems to have grown by volume. Importantly, the OCR appears to remain a strong base for Landed properties, showing more interest and perhaps new entrants into this market sub-segment as upgraders. The data also points to more interest in larger landed properties in the OCR and RCR.

In Table 1 below, we compare the RCR and CCR premiums across the different sub-segments that we have covered in the micro trends analysis. Importantly, we notice a decline in RCR premium over the OCR from January to June across almost every segment. This shows that the disparity gap between the RCR and OCR has closed to some extent and signals a strong OCR price and volume growth in 1H2024. This trend appears to be persistent from the above analysis.
The CCR premium over the RCR has increased for new condo launches and landed properties but decreased for all other sub-segments. This indicates that the CCR interest may be concentrated around the particular niches of new launch condos and landed properties.
Events and Trends in 2H2024

The first half of 2024 has seen the market normalising to the peaking interest rates and has seen favourable signs in policy and land sales that indicate cautiously optimistic sentiment in the residential real estate market. The micro trends indicate steady price and volume growth in the OCR across all residential real estate segments, which are a trademark of a healthy market.
Whilst the RCR premium is declining, demand and interest is still strong as consumers can look to more options from TOP projects in the RCR for condominiums. The specific sub-segments for the new launch condos and landed properties appear to have benefited the most in terms of CCR premium.
The residential real estate market appears to be stable and waiting for a catalyst for more volume to enter the market. With consumer sentiment increasing steadily, there is a good basis on both macro and micro terms to support a stronger 2H2024 performance for residential properties.
Catalysts for such movement in the market may be potential interest rate cuts coming from growing Fed confidence in achieving disinflation, and potentially mildly favourable real estate policy that may be announced around National Day or General Elections targeting specific market niches. Such catalysts may see residential real estate markets respond bullishly, and take a few quarters to reflect increases in volume and price. This would be in confluence with an increase in supply coming from TOP condominium projects across the country, feeding consumers with better choice units for their desired home.
The GLS for 2H2024 will also indicate longer term sentiment from developers in the coming years. Should the upcoming GLS in 2H2024 continue to attract lower bids, we may see disinflationary effects in the coming years for residential properties, which may improve the competitiveness of new condo launches in the future. On the contrary, competitive bidding may support higher prices for future new launches.
Key Takeaways for Homeowners and Buyers
